
Skip to content

Real-Time Dashboards

for Higher Education Governance, Compliance, and Risk Management

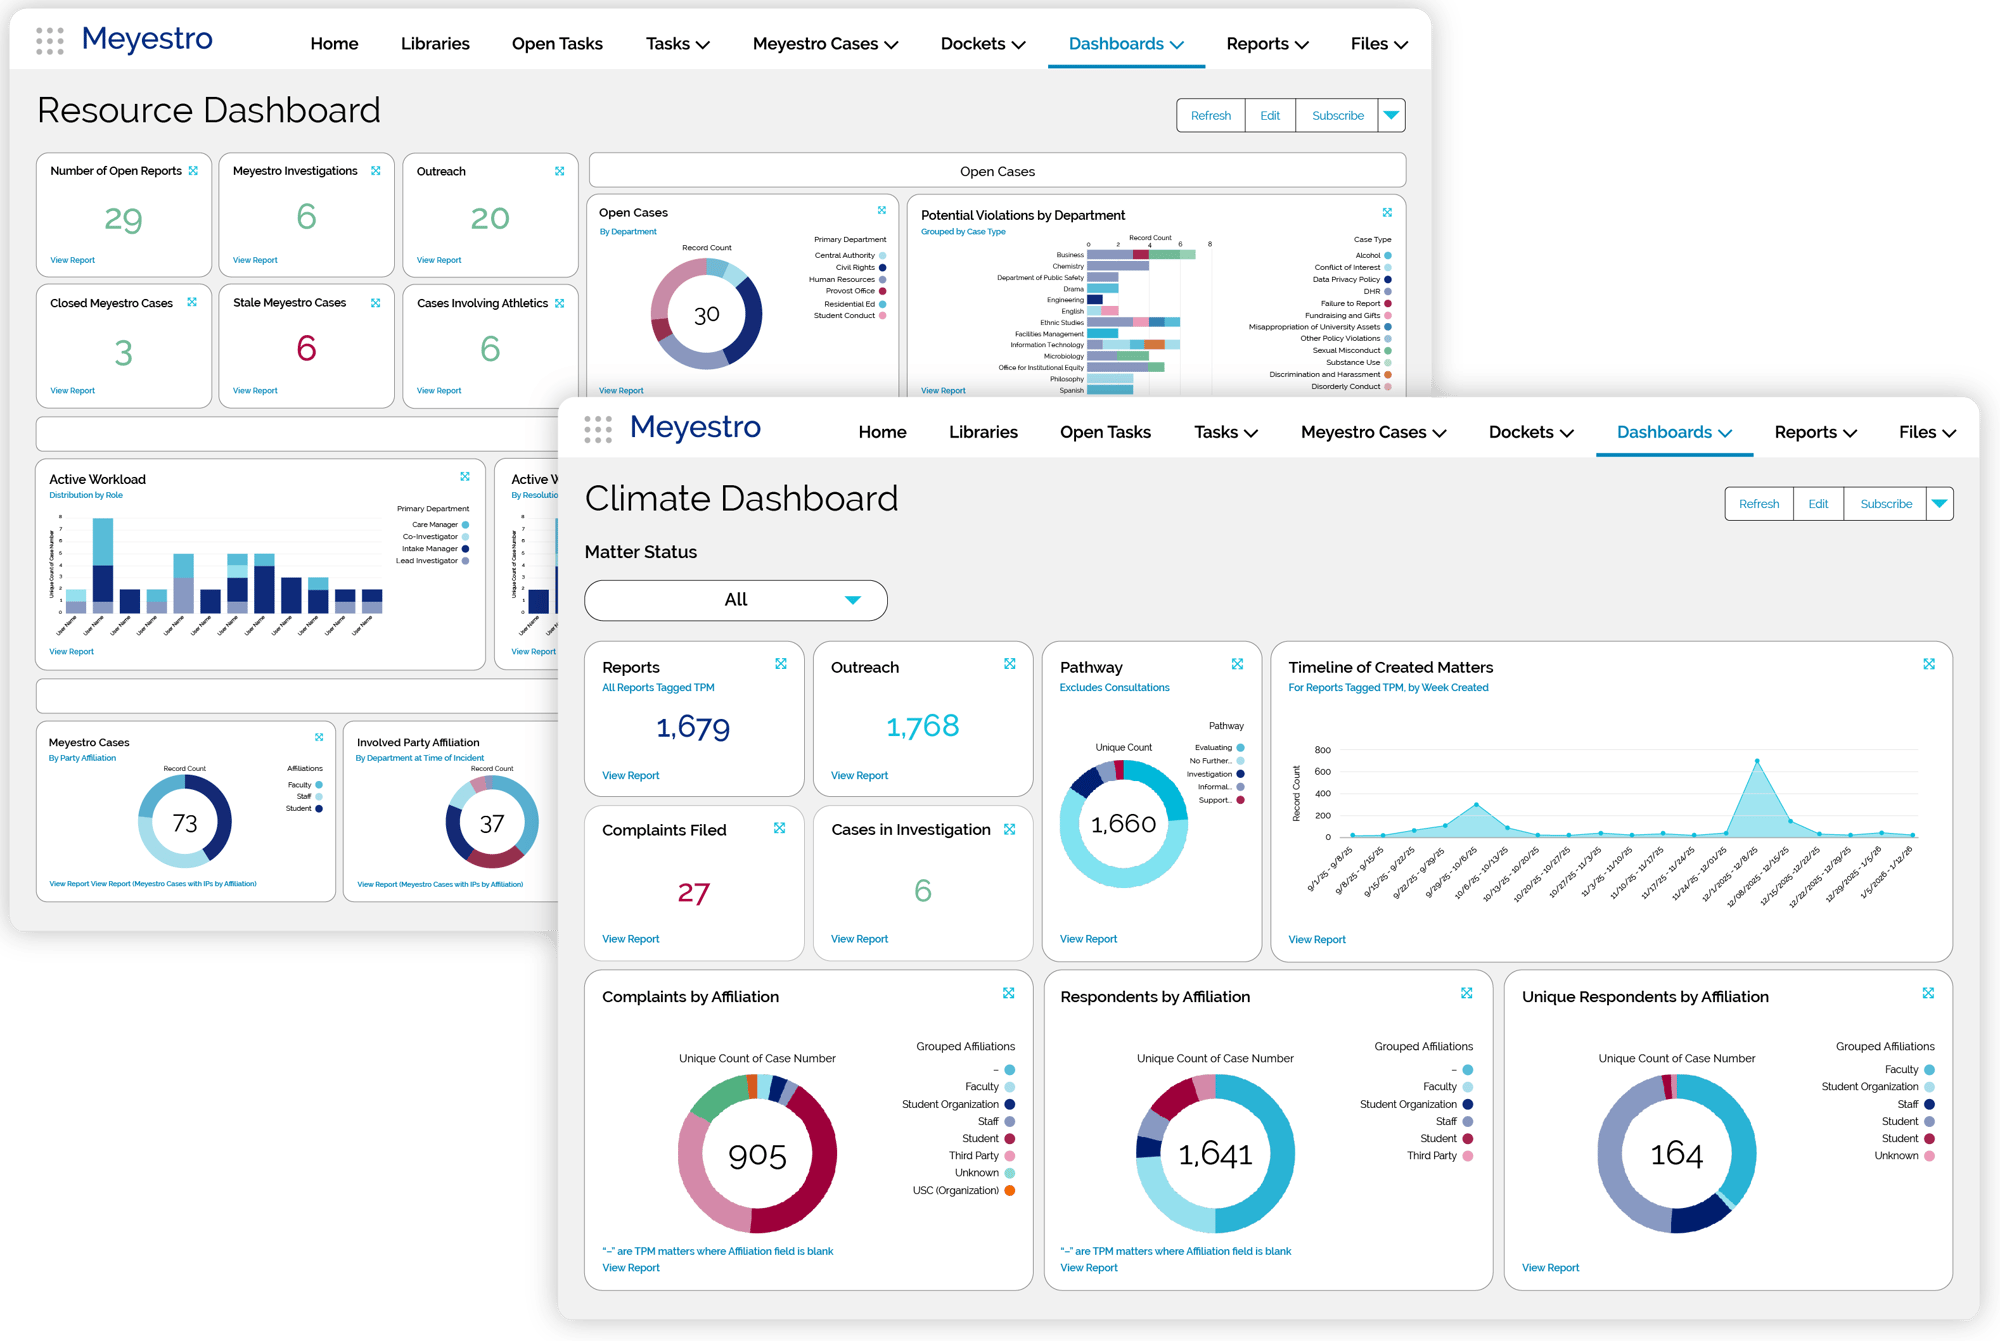
dashboard_hero-2

360-Degree View of Institutional Risk, Response Activity, and Campus Climate

Meyestro dashboards are powerful business intelligence tools providing visualizations of critical enterprise incident, risk, and compliance data in real time.

Drawing from centralized, validated institutional data, dashboard views help leaders and managers monitor climate, compliance activity, workload, case progress, and emerging patterns while permission-based guardrails protect sensitive information.

See the patterns, pressure points, and response activity that remain hidden or obscured in fragmented settings.

Visibility Breaks Down Inside Silos

LEADERS SEE TOO LATE
Risks often become visible only after they have materialized as significant harm, matured into claims or litigation, or erupted in crisis.
REPORTS FLATTEN THE CONTEXT
Matrices and periodic assessments and their associated counts and charts are useful, but do not easily provide drill-down context or real-time insights.
SILOED DATA HIDES INSTITUTIONAL PATTERNS
When each office sees only its own activity, broader climate, conduct, compliance, and care patterns can be difficult to recognize.
ACCESS IS DIFFICULT TO BALANCE
Effective governance and oversight require visibility, but sensitive information needs role-based guardrails that protect privacy and departmental autonomy.

How Meyestro’s Role-Based Dashboards Work

Turn Case Data Into Real-Time Visibility

Dashboards visualize real-time data so institutions can monitor events and manage risk more proactively.

Give Each Role the Right View

Match visibility with each user’s role, responsibility, and access permissions, so leaders, managers, and response teams can see what they need without unnecessary exposure.

Monitor Trends, Climate, and Case Activity

Dashboard views show institutional climate, department performance, and incident and response statistics and trends to help teams recognize patterns, monitor compliance performance, and operationalize governance with real-time feedback.

Move From Summary to Context

Authorized users can drill from high-level statistics and aggregated data into the underlying context, connecting the big picture and overall trends to specific events on the ground.

Configure Views Around Institutional Needs

Dashboards can be flexibly configured to answer the different questions asked by leaders and managers.

How Dashboards Support Better Institutional Decisions

With real-time dashboard visibility, institutions can:

  • Prioritize leadership attention based on emerging trends, locations, matter types, departments, involved party affiliations, or other variables.
  • Match staffing and resources to workload, case aging, throughput, and operational pressure points.
  • Understand and anticipate shifts in campus climate, compliance activity, or case volume as conditions change.
  • Move from fragmented status updates to actionable information.
  • Enhance institutional learning and process improvement with clearer context behind the numbers.
  • Support briefings, regulatory response and reporting, and institutional decision-making with confidence.
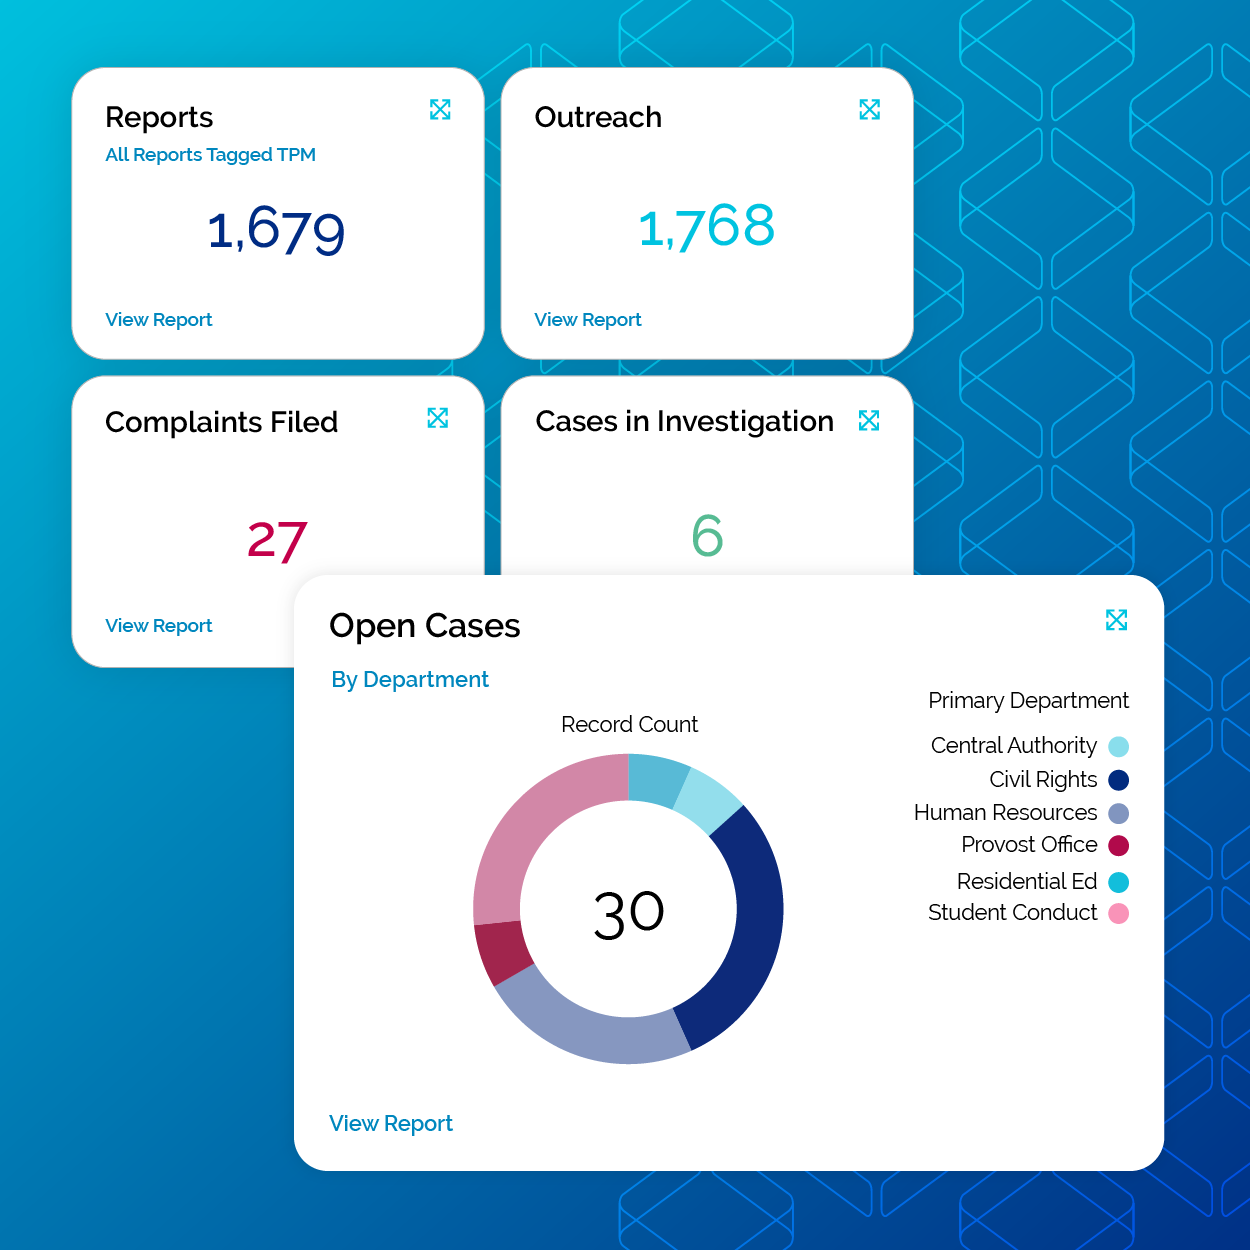
platform_dashboards-2

Dashboards for Monitoring Climate, Compliance, and Capacity
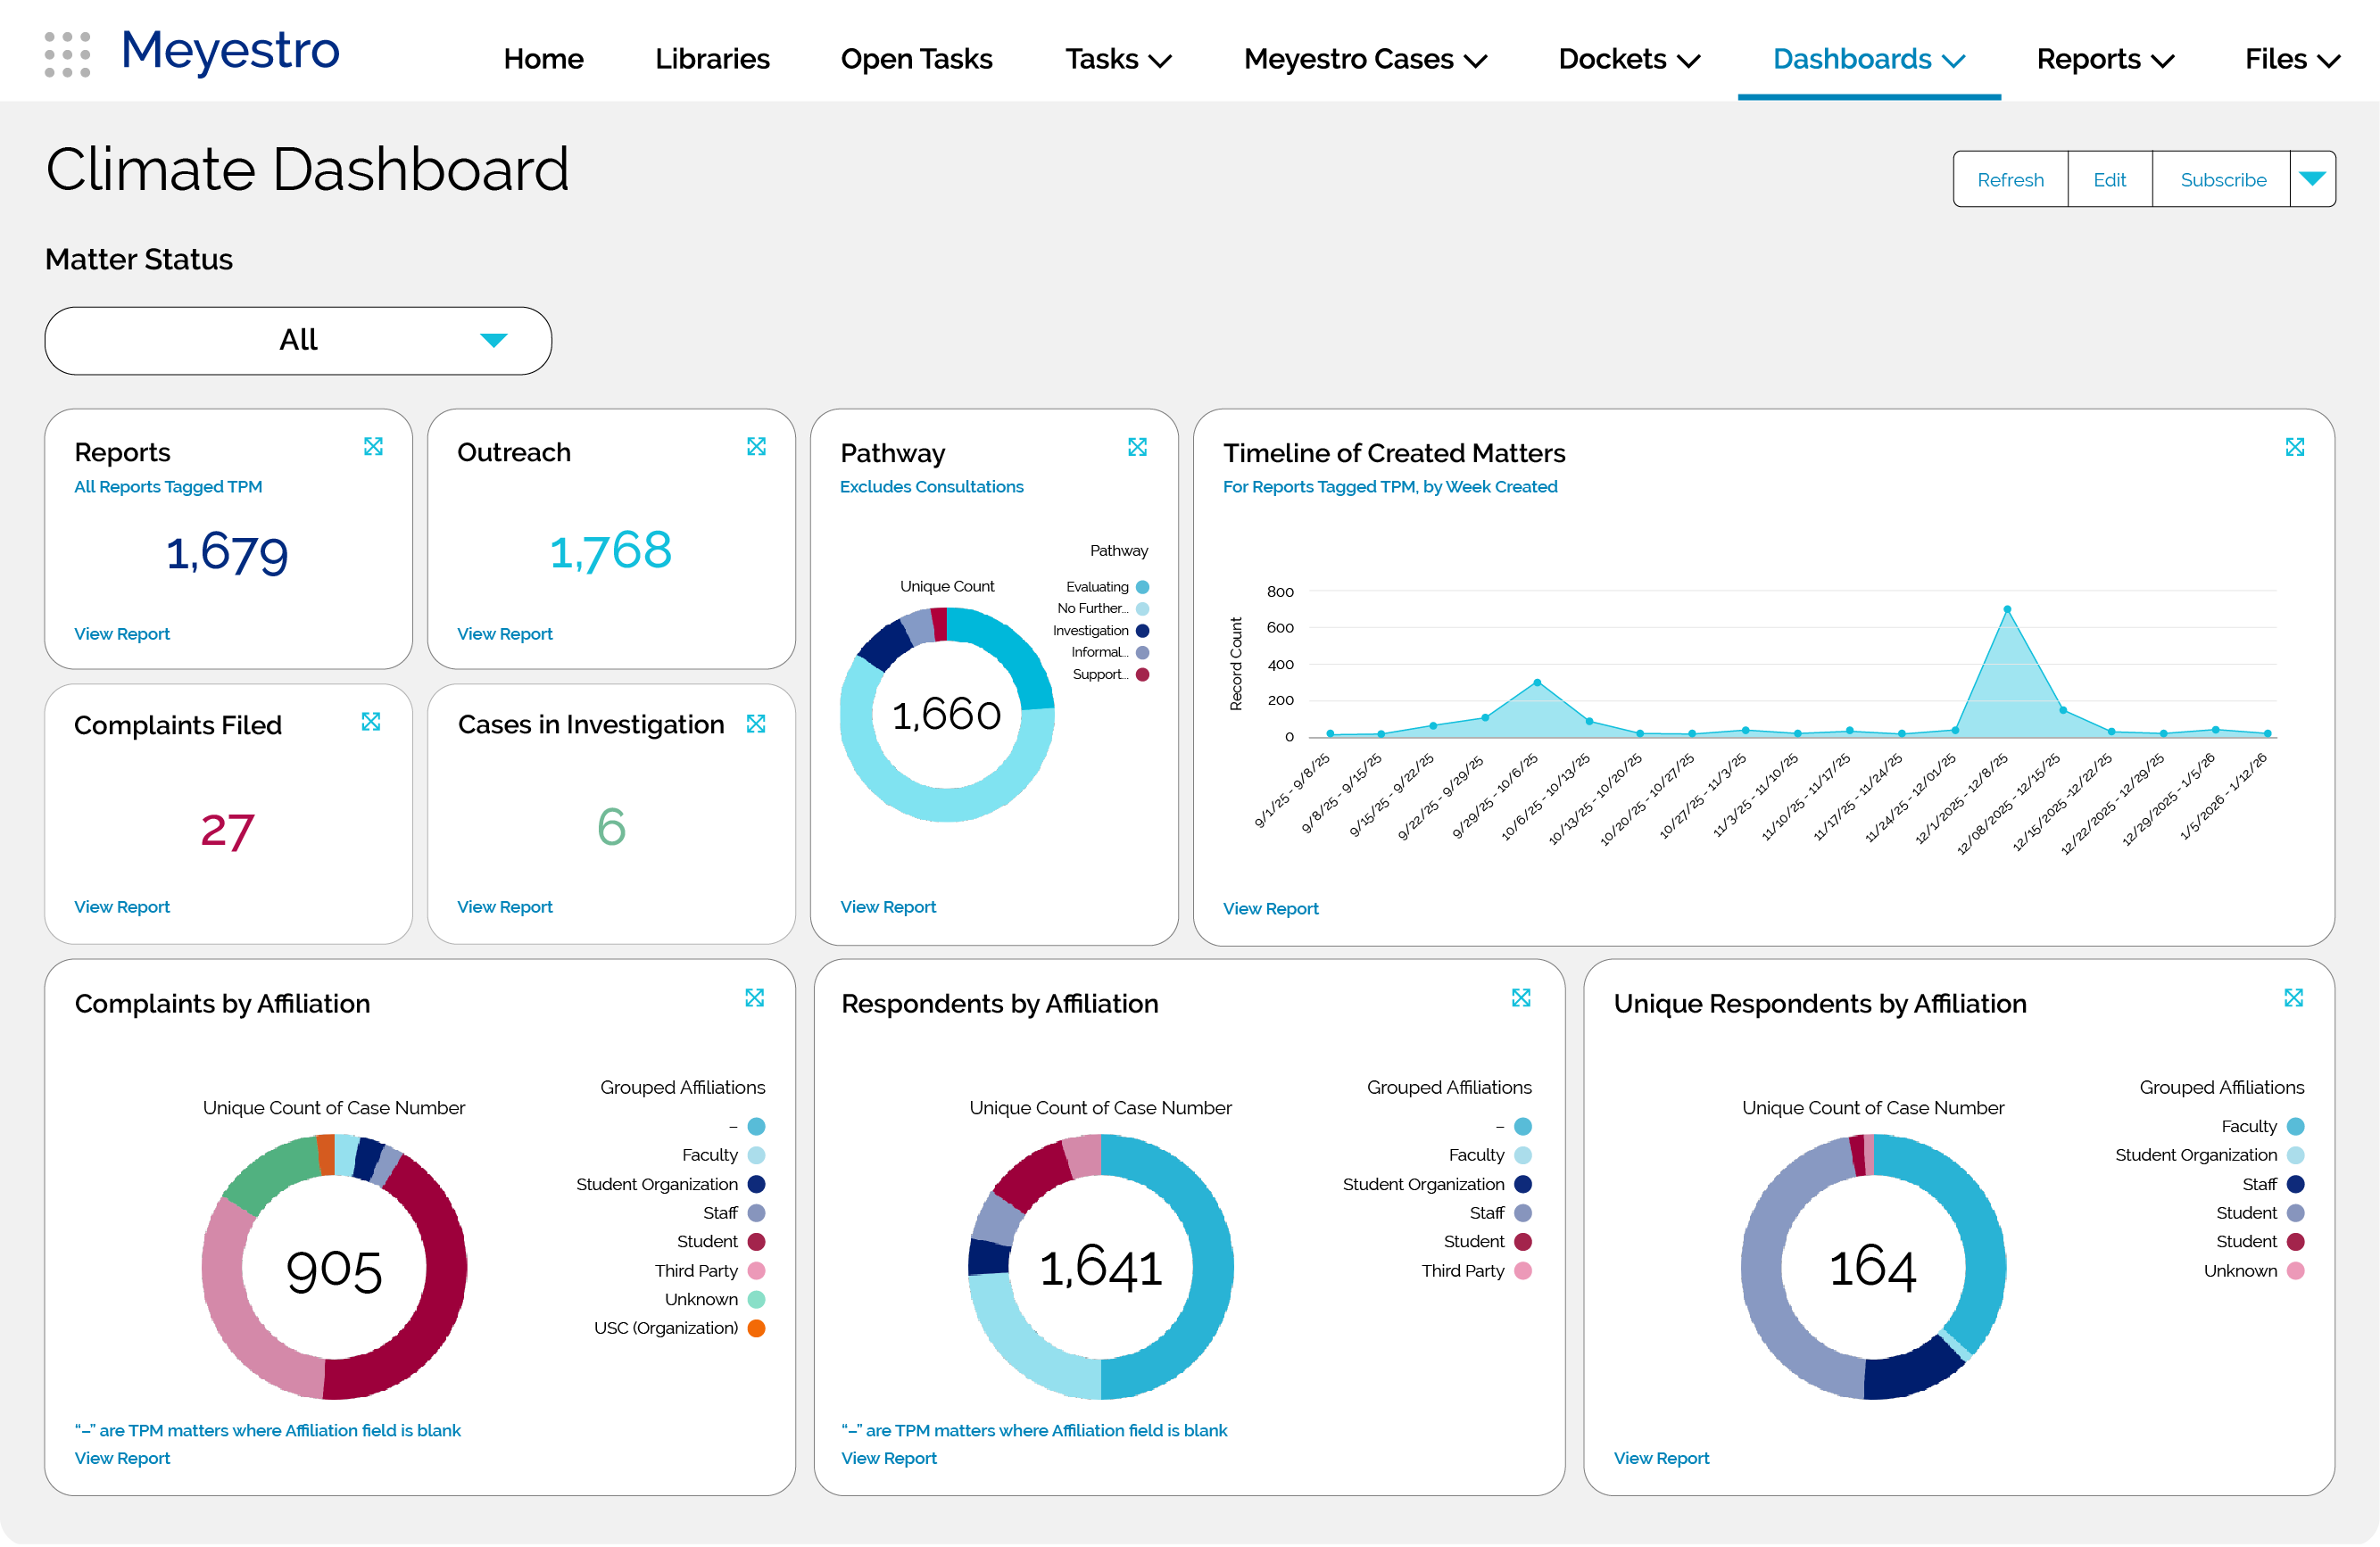
dashboard_climate-assessment-2

Climate Assessment Dashboards

Help leaders and managers understand trends, hotspots, and emerging areas of concern.

  • Monitor case volume and trends in real time.
  • Identify patterns.
  • Deepen climate analysis with data connected to underlying matter records.
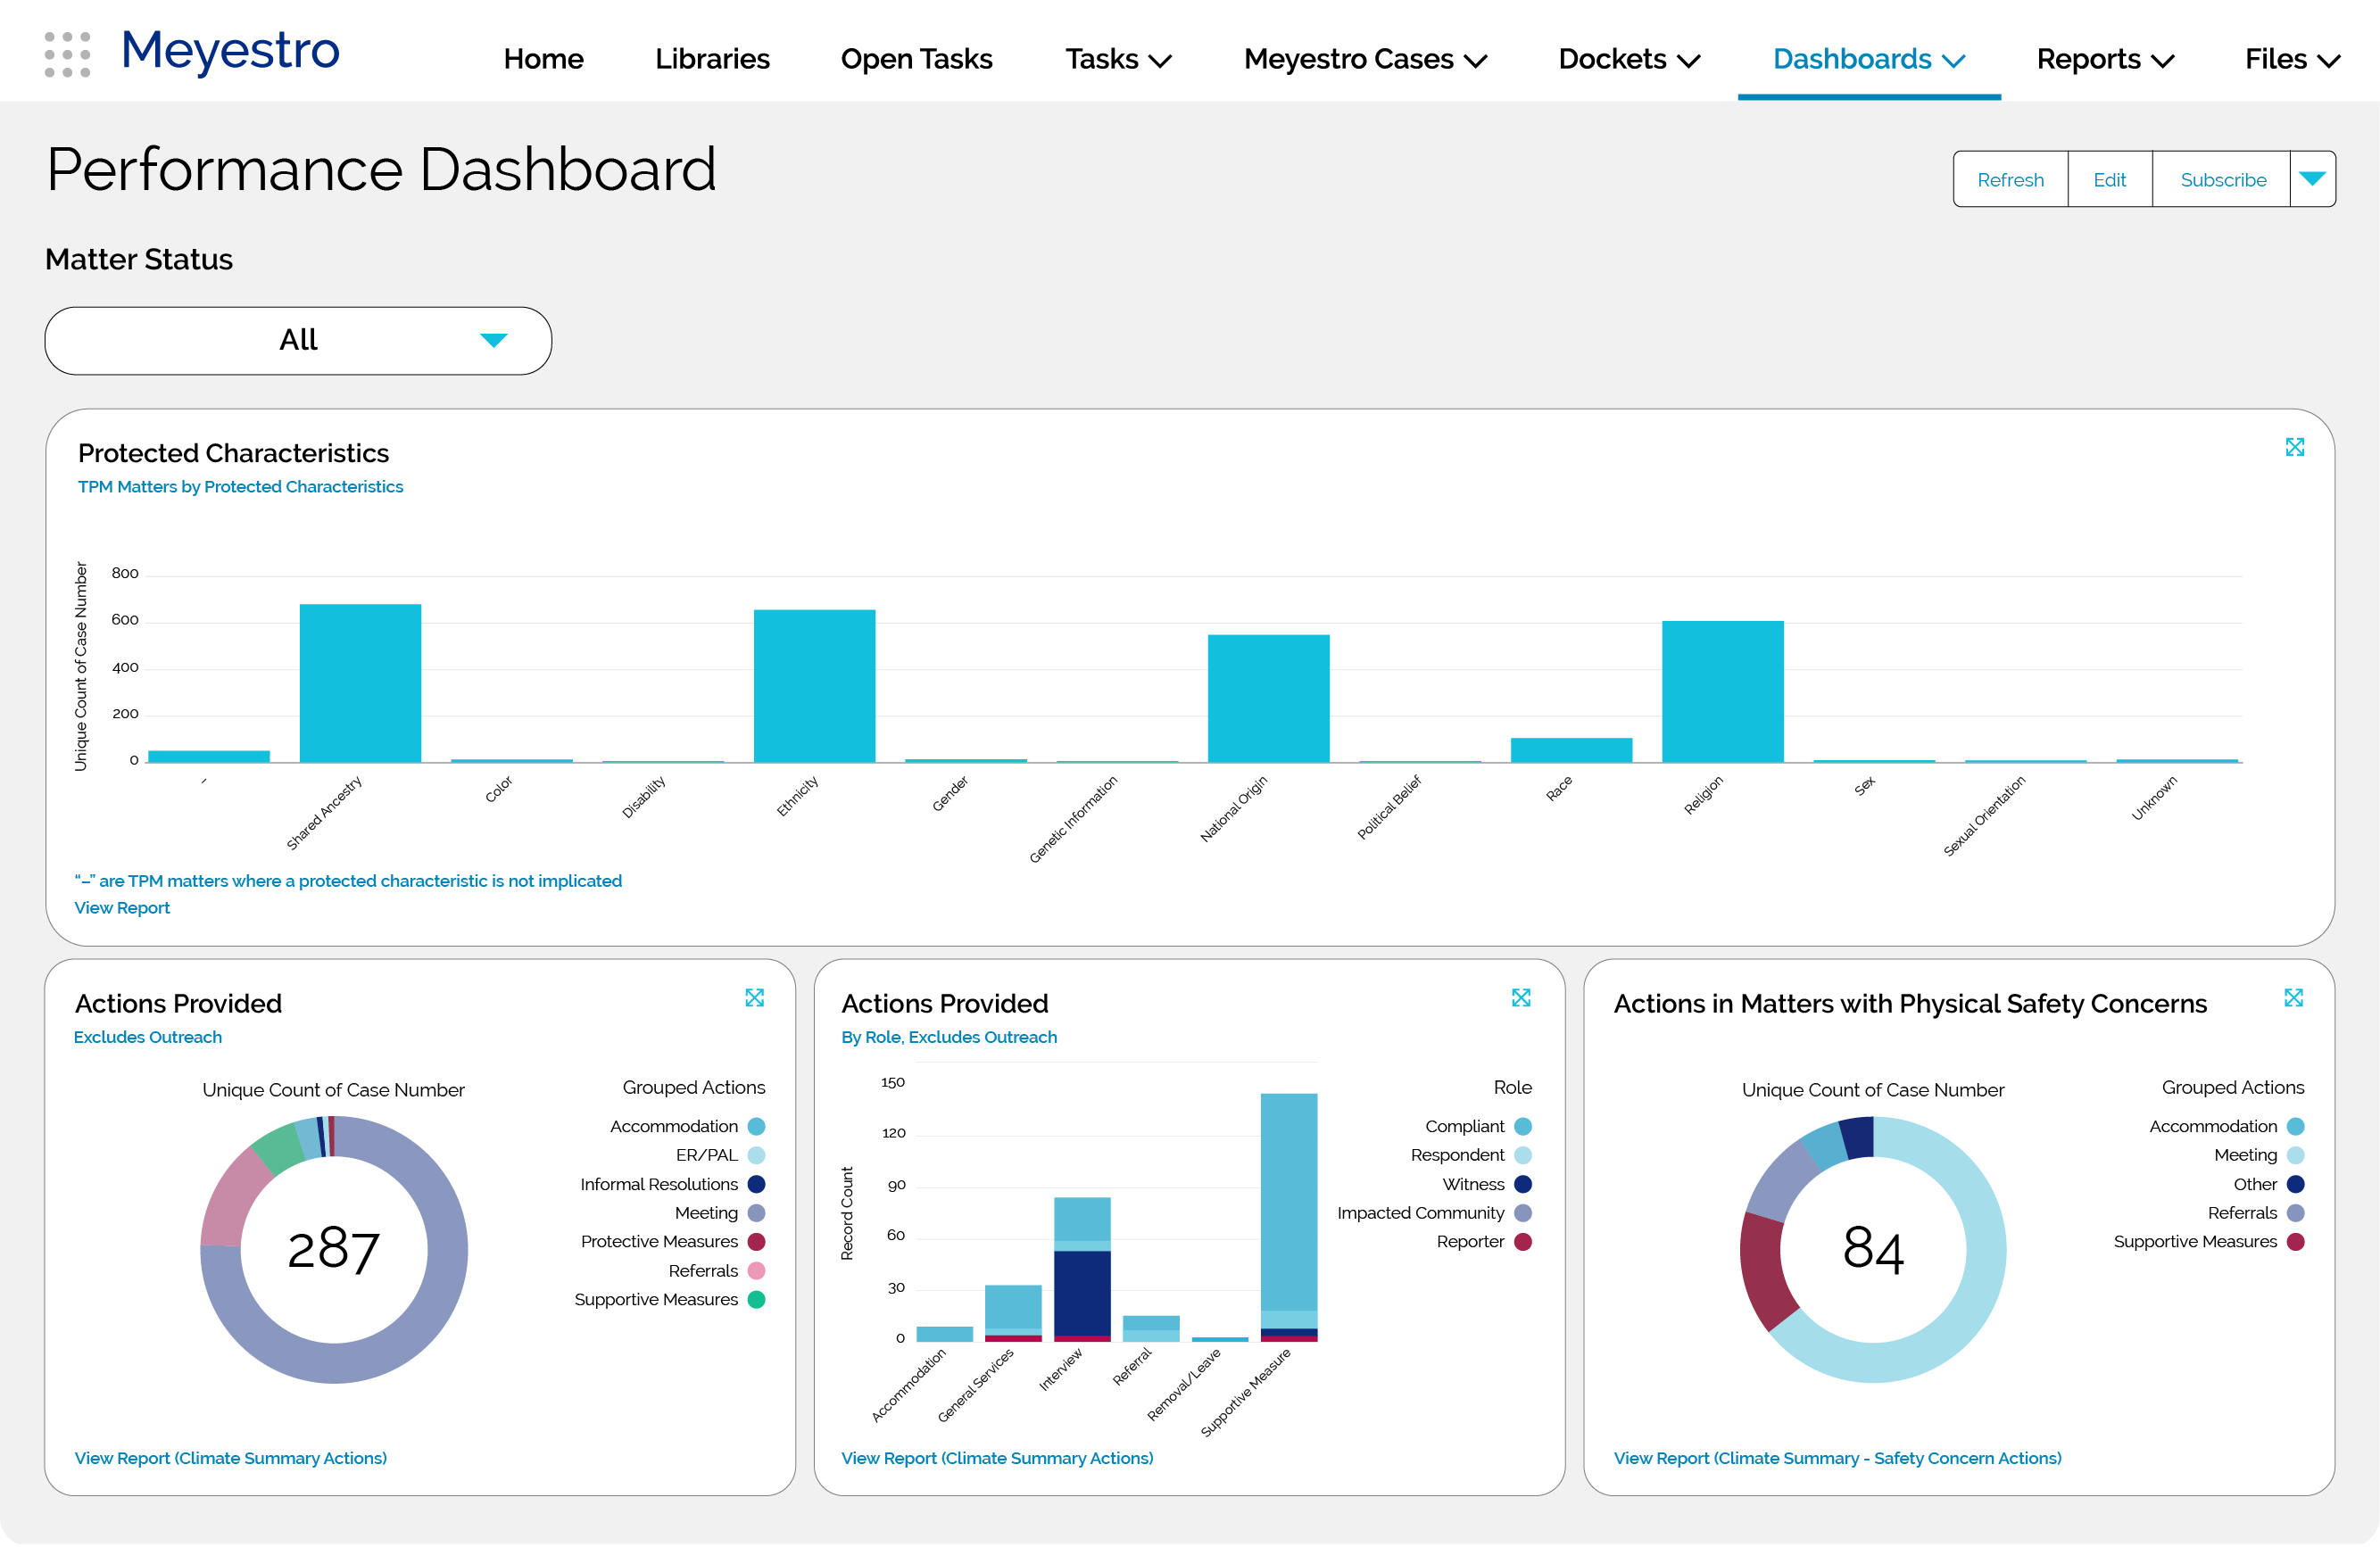
dashboard_compliance-performance-2

Compliance Performance Dashboards

See whether cases are moving, how timelines are being managed, and where the choke points are.

  • Monitor case aging, resolution timelines, and matter throughput.
  • Track care and compliance quality indicators across teams and team members.
  • Support required reporting and community communications with better visualized data.
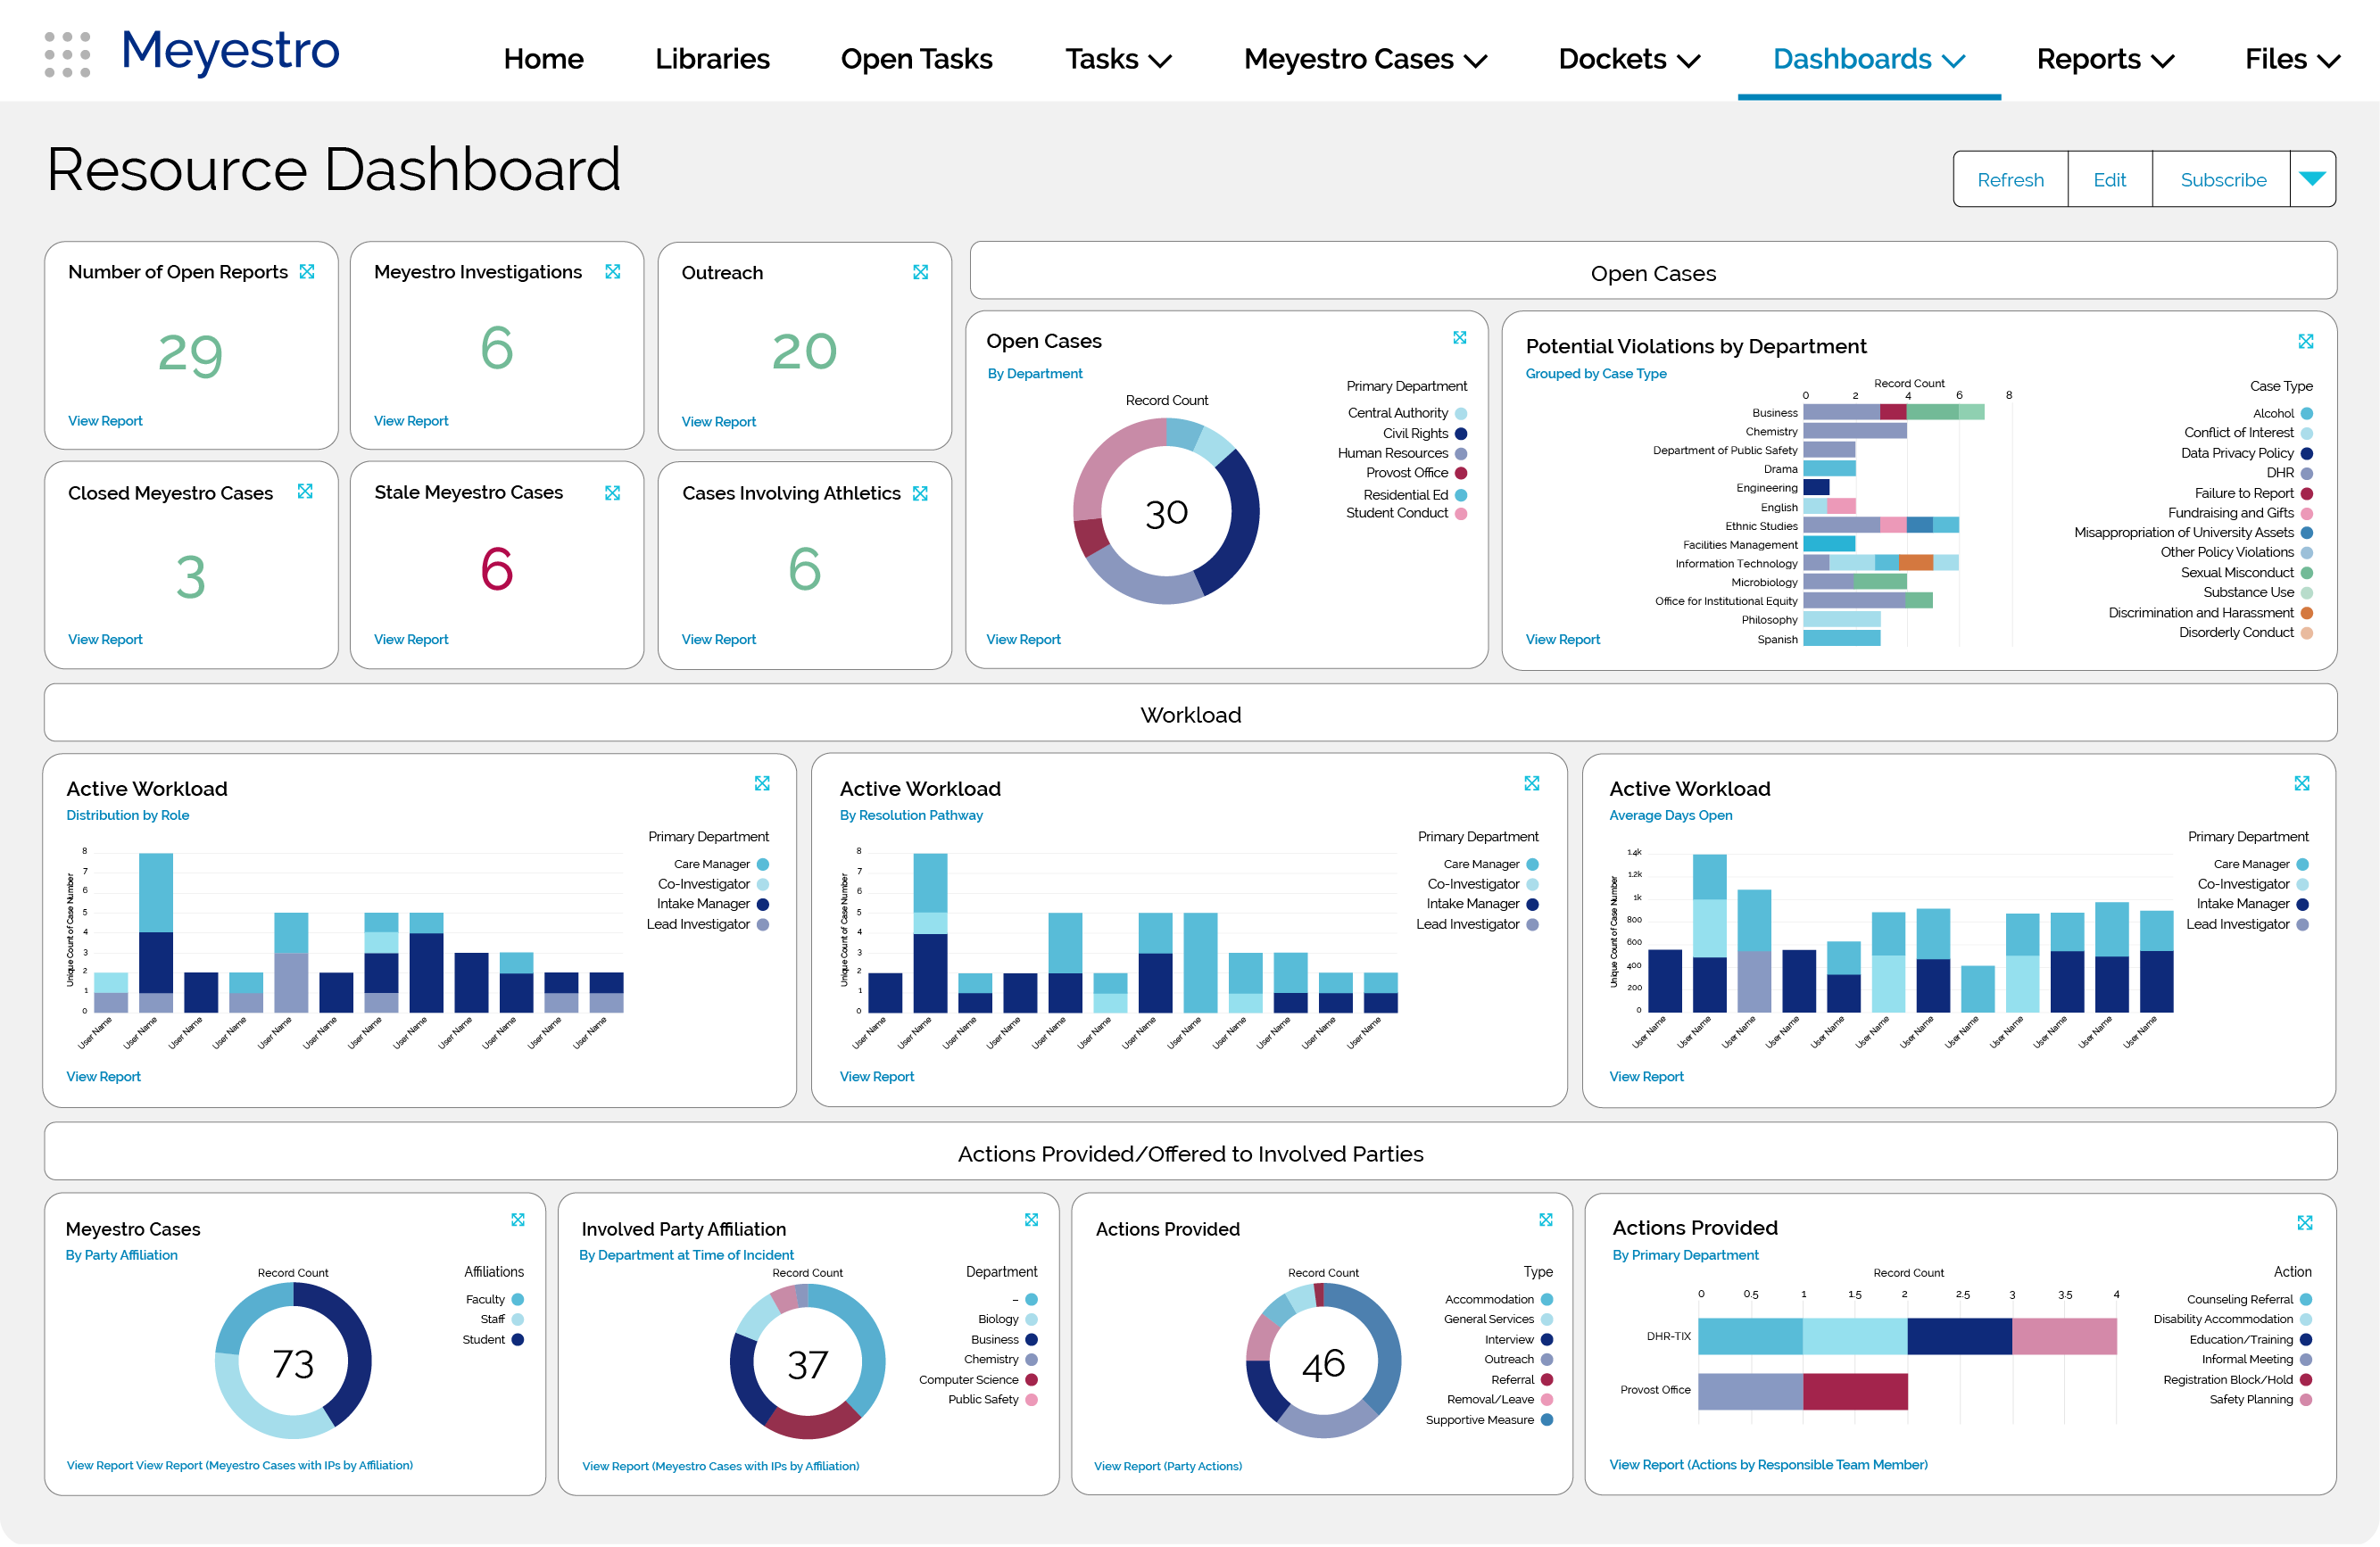
dashboard_resource-allocation-2

Resource Allocation Dashboards

Help managers and leaders see where work is concentrated and whether current response capacity aligns with institutional needs.

  • View workload distribution across teams and team members.
  • Identify bottlenecks and resource constraints.
  • Support resource planning with clearer operational evidence.
EXAMPLE

Campus Climate Monitoring During Heightened Social Tension

A university hosts a speaker event that draws protests, counter-protests, and significant online discussion. In the days that follow, reports come in from students, faculty, and staff. Some describe bias-related comments. Others involve safety concerns near residence halls, classroom tension, social media conduct, and requests for support from affected students.

Where Meyestro’s Real-Time Dashboards Support the Institution’s Response

The result is 360-degree visibility of the campus climate in the moment: whether seemingly disparate incidents should be understood as connected or related, where concerns are emerging, which communities are affected, which teams are engaged, and where leadership attention is needed.
graphic_real-time-dashboards

From Real-Time Dashboards to Institution-Wide Readiness

Dashboards give leaders and managers the visibility to understand what is happening across incidents, locations, schools, offices and other institutional areas. Reporting turns that visibility into structured outputs for briefings, oversight, regulatory response, and institutional decision-making.

Turn Dashboard Insight Into Prepared Reporting

Explore Automated Reporting

Also Explore: Guided Workflows
Frequently Asked Questions: Real-Time Dashboards in Meyestro

Where Compliance Meets Care™

Meyestro helps universities harmonize expert risk management, efficient compliance, and demonstrable care.