
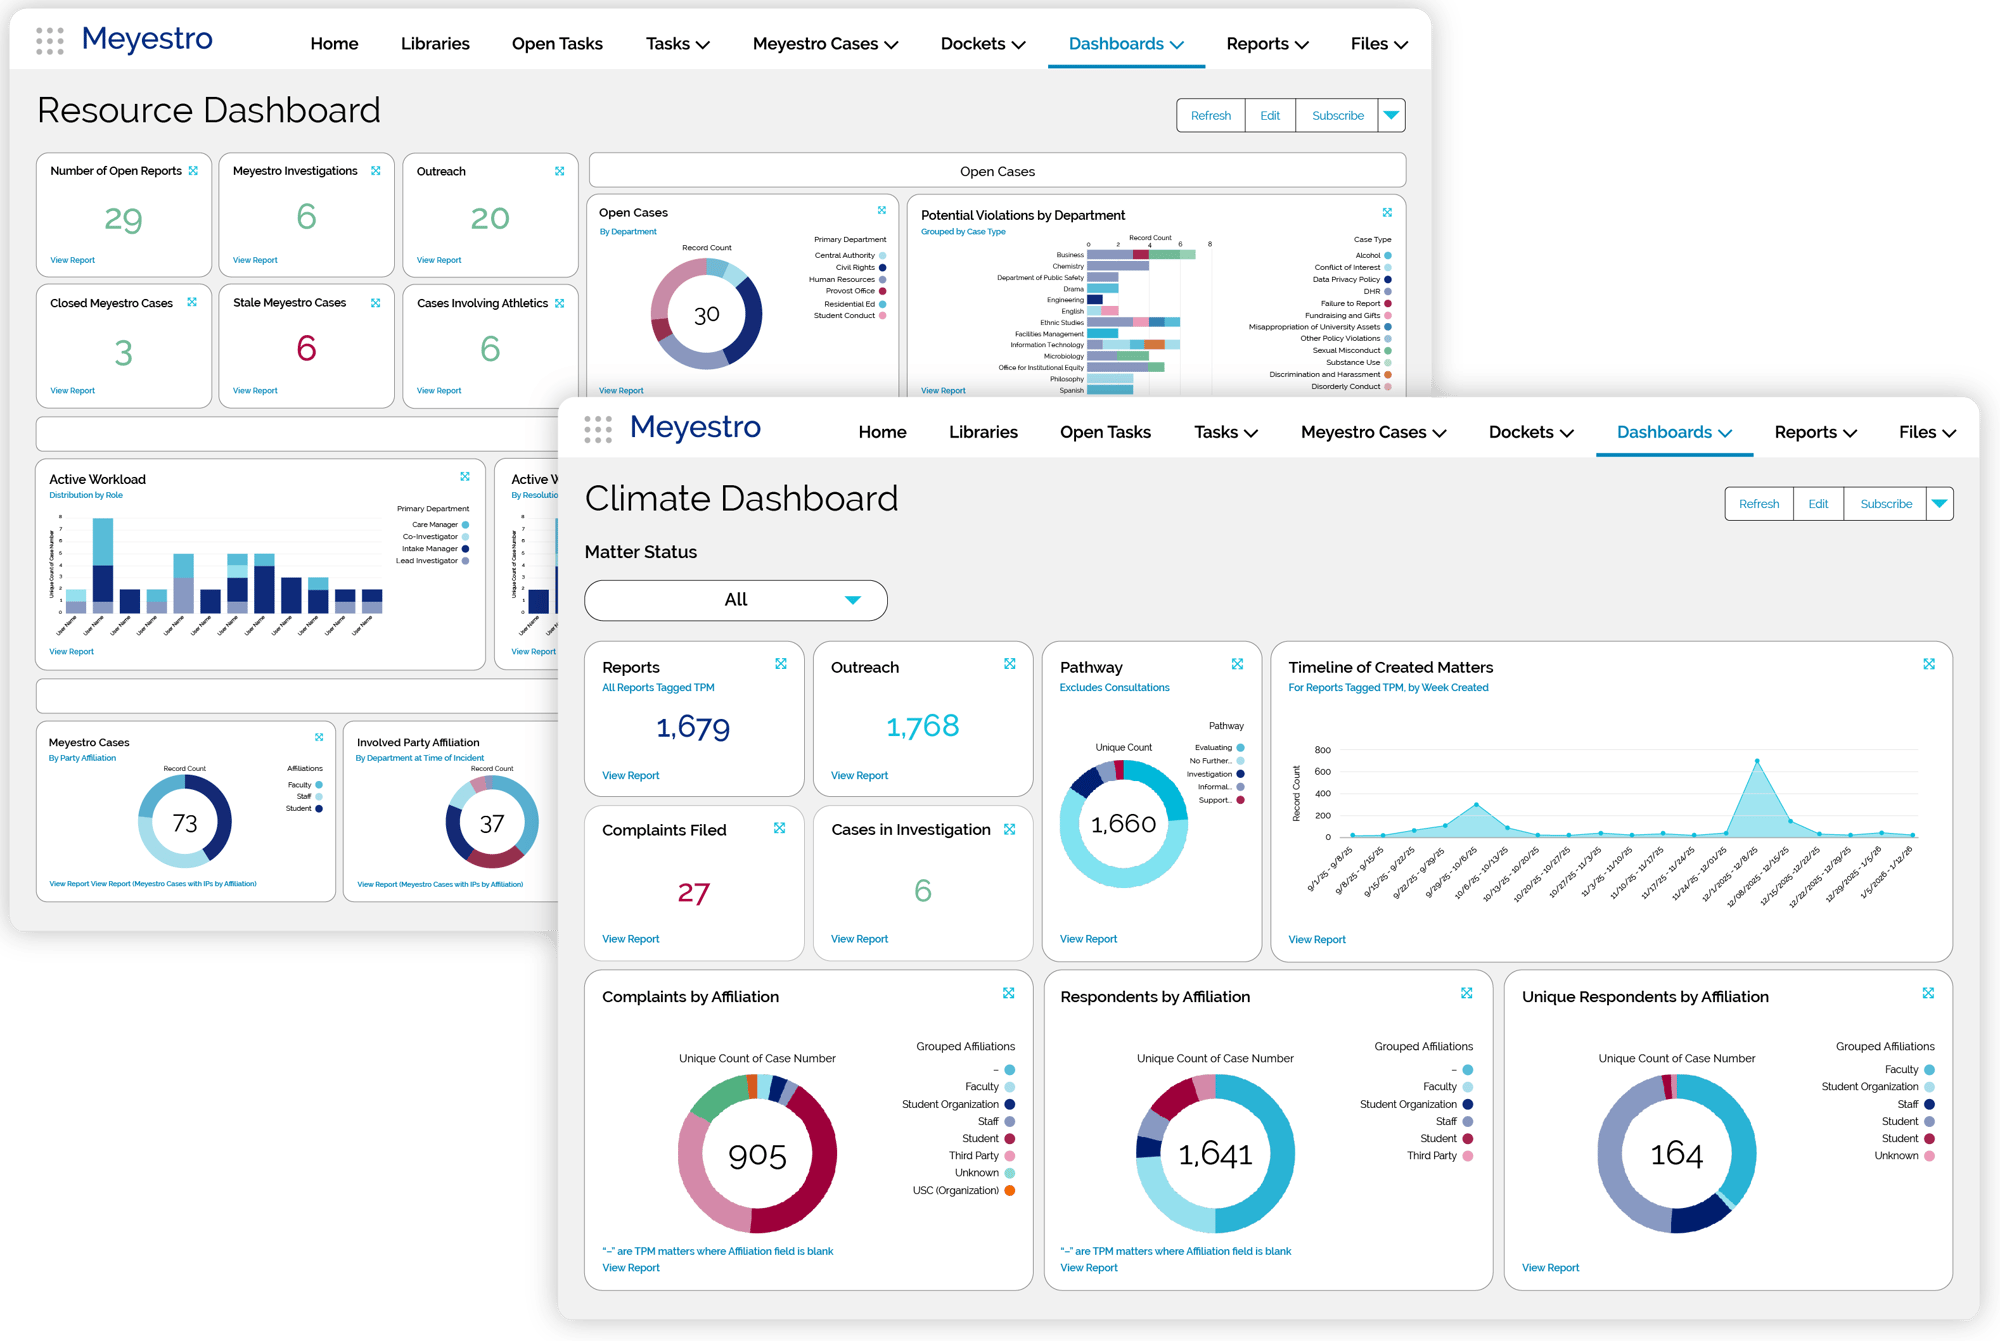


How Dashboards Support Better Institutional Decisions
With real-time dashboard visibility, institutions can:
- Prioritize leadership attention based on emerging trends, locations, matter types, departments, involved party affiliations, or other variables.
- Match staffing and resources to workload, case aging, throughput, and operational pressure points.
- Understand and anticipate shifts in campus climate, compliance activity, or case volume as conditions change.
- Move from fragmented status updates to actionable information.
- Enhance institutional learning and process improvement with clearer context behind the numbers.
- Support briefings, regulatory response and reporting, and institutional decision-making with confidence.
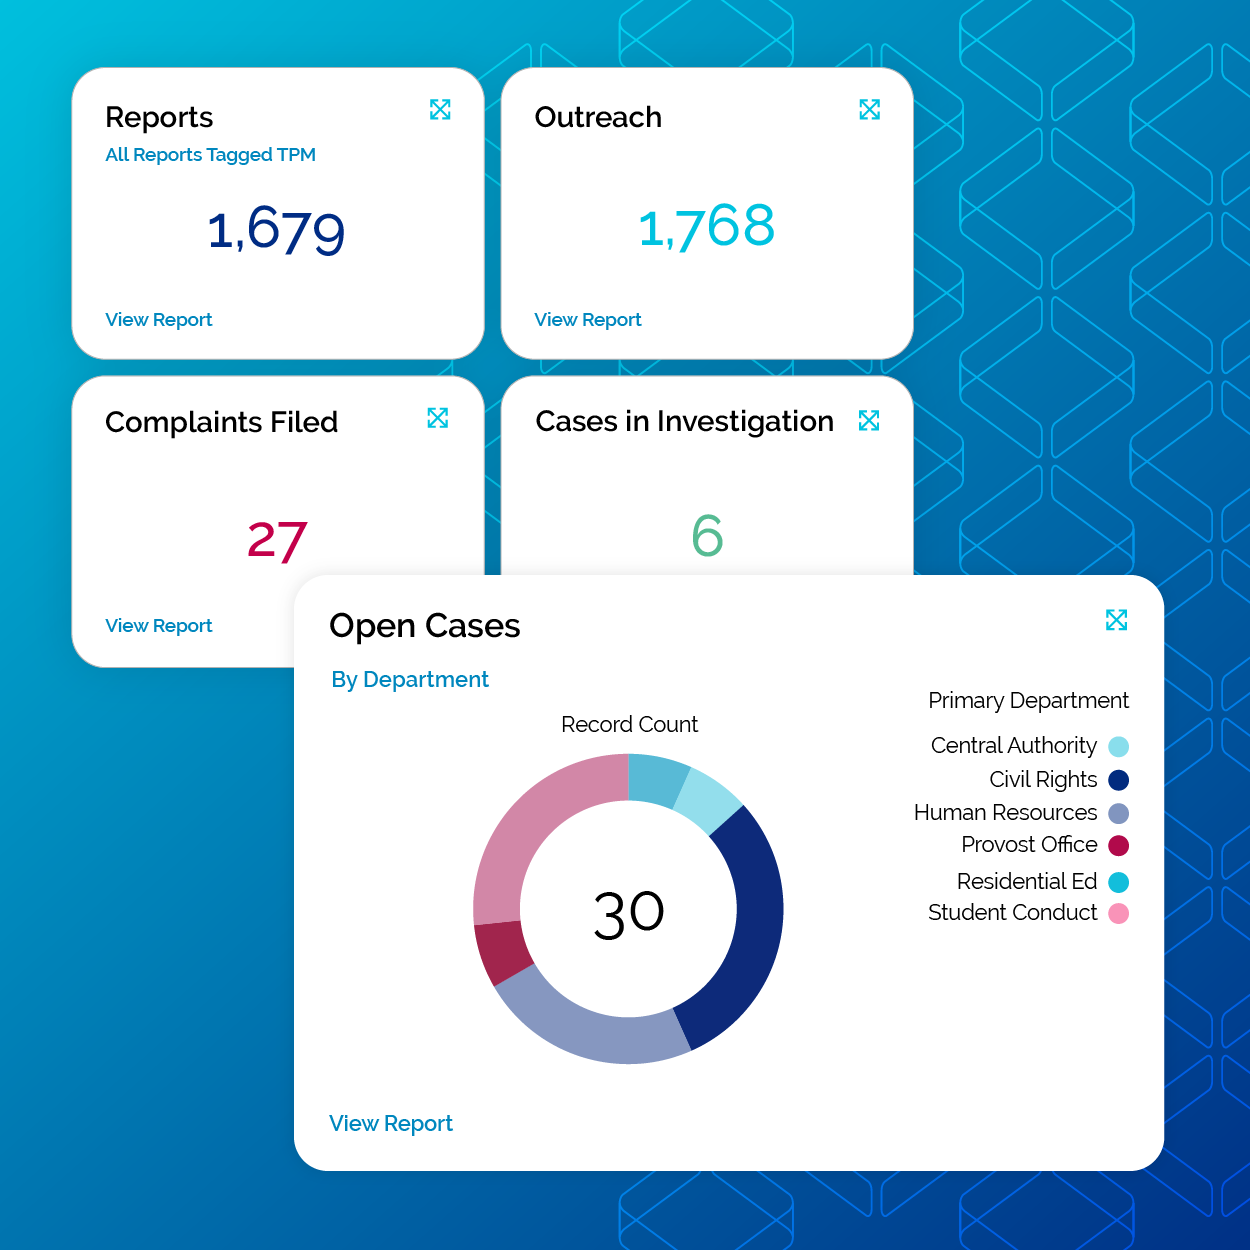
Dashboards for Monitoring Climate, Compliance, and Capacity
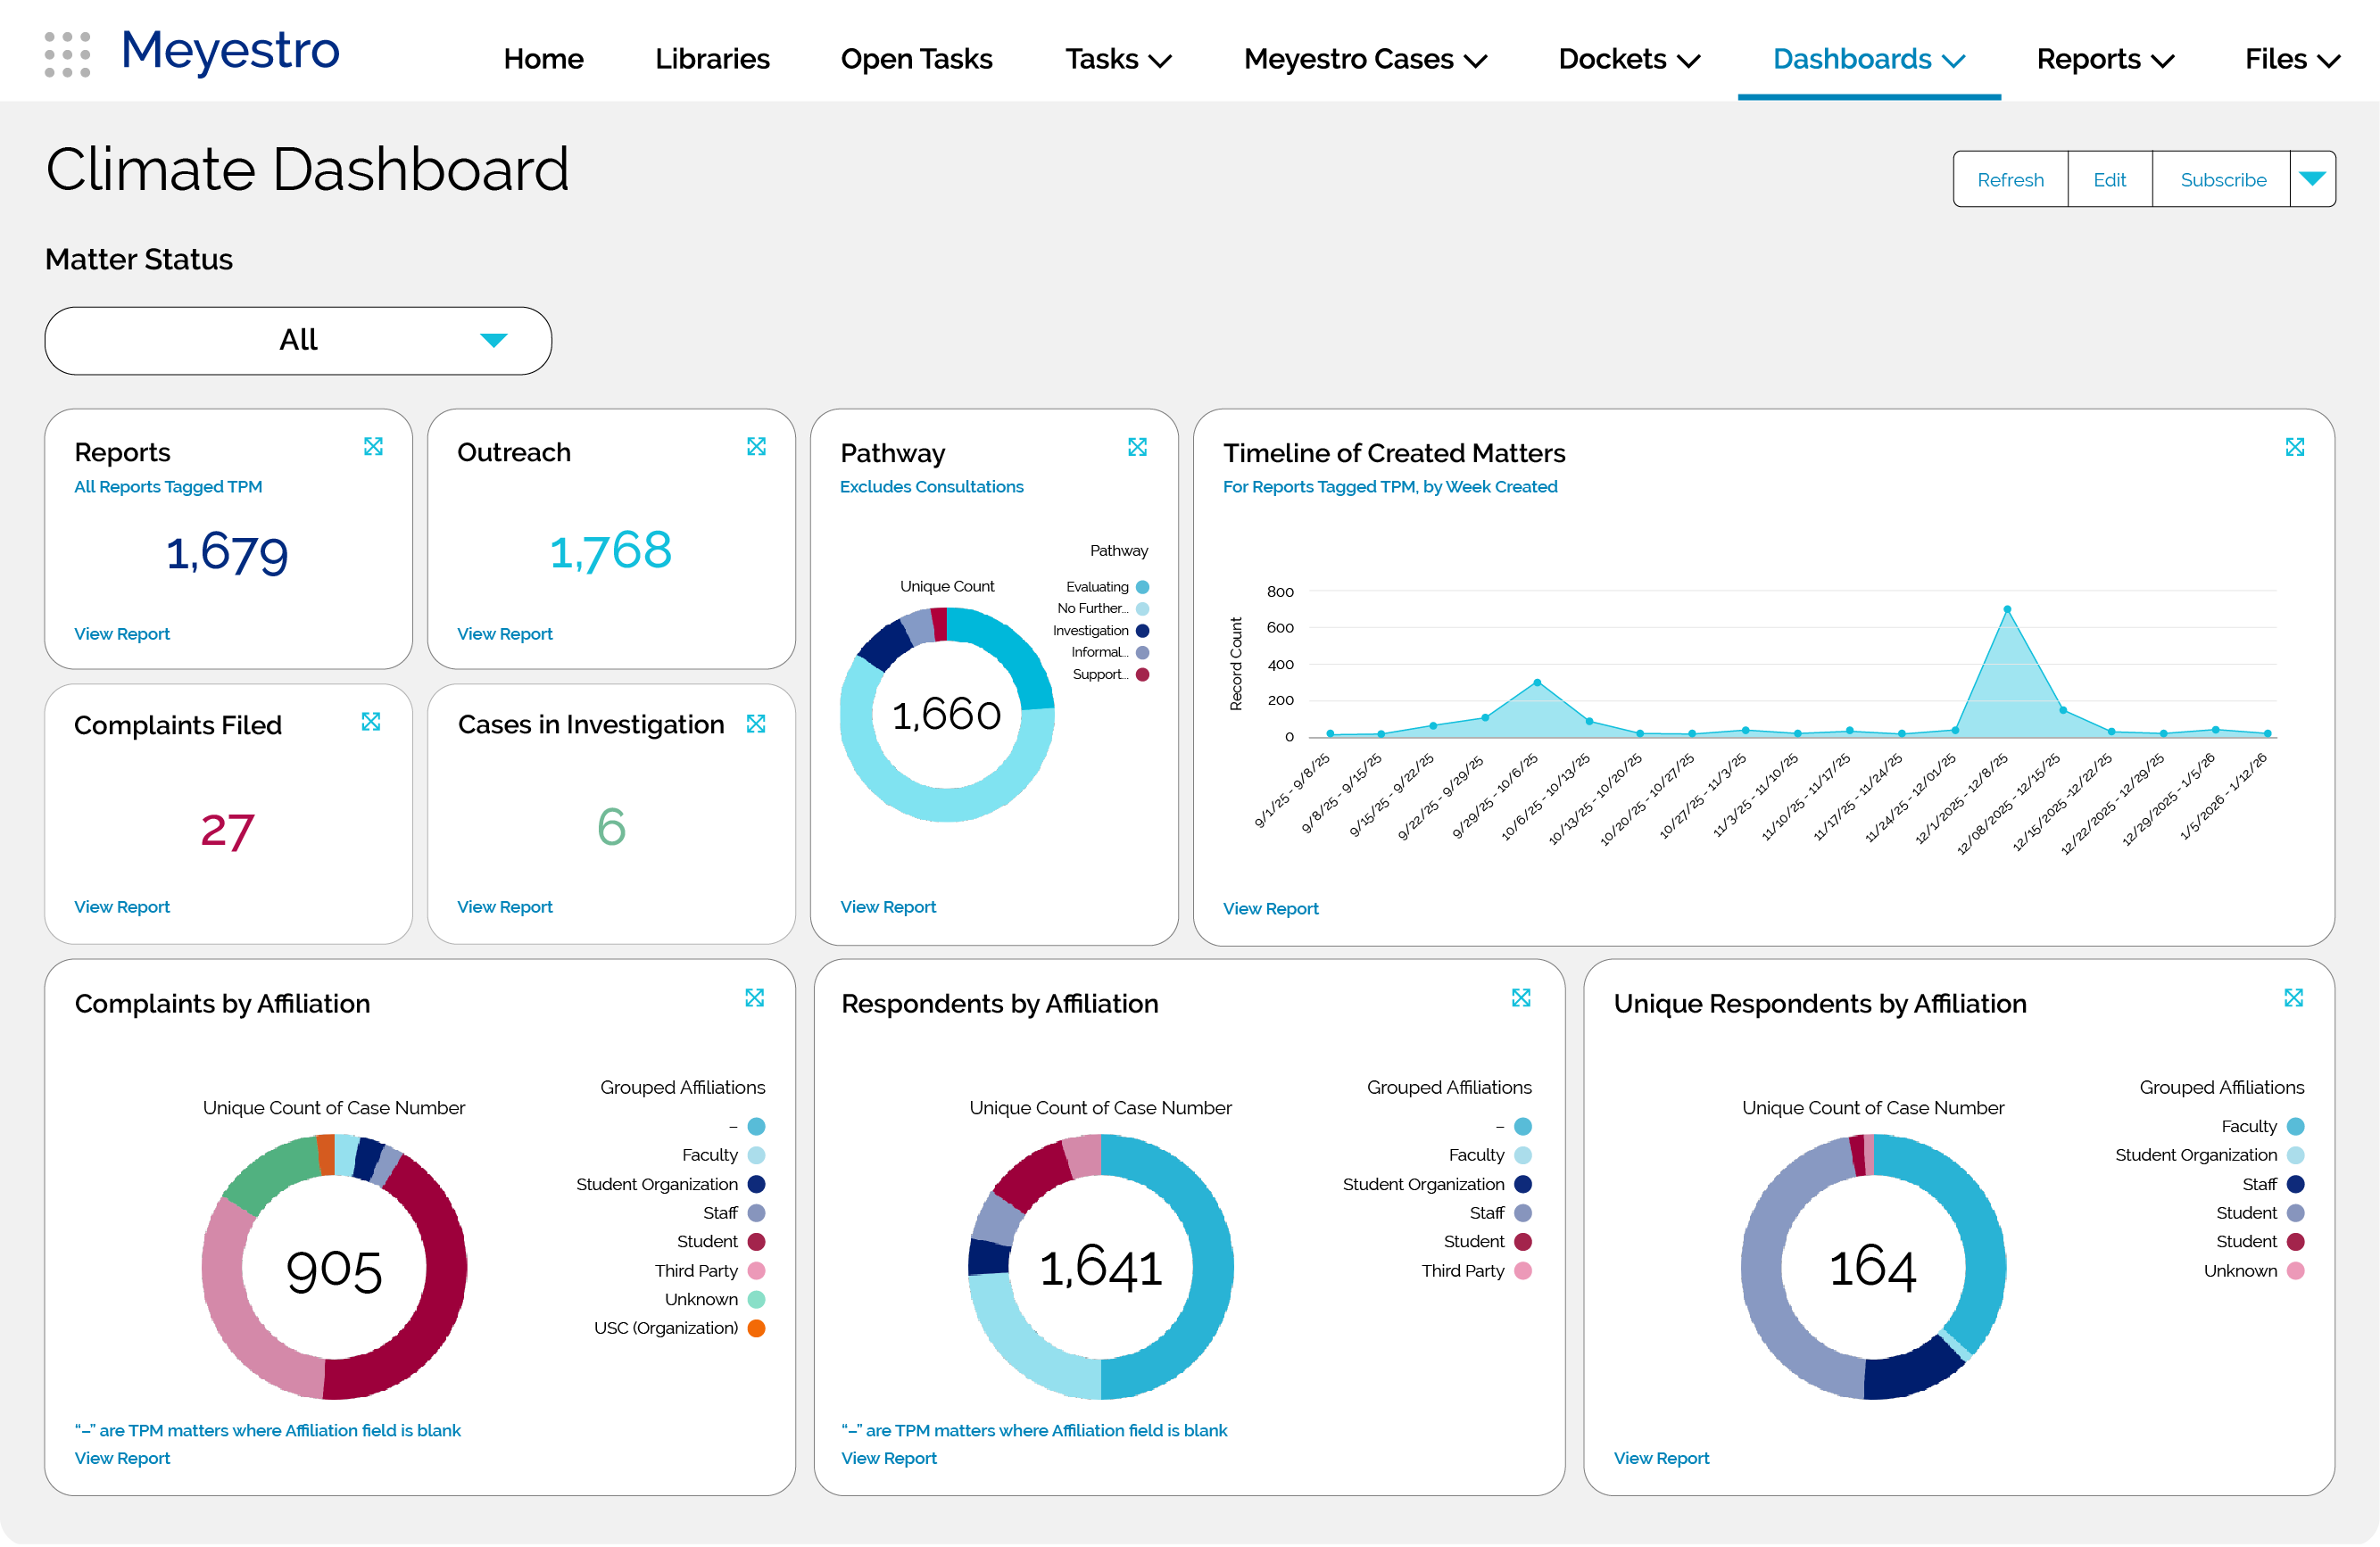
Climate Assessment Dashboards
Help leaders and managers understand trends, hotspots, and emerging areas of concern.
- Monitor case volume and trends in real time.
- Identify patterns.
- Deepen climate analysis with data connected to underlying matter records.
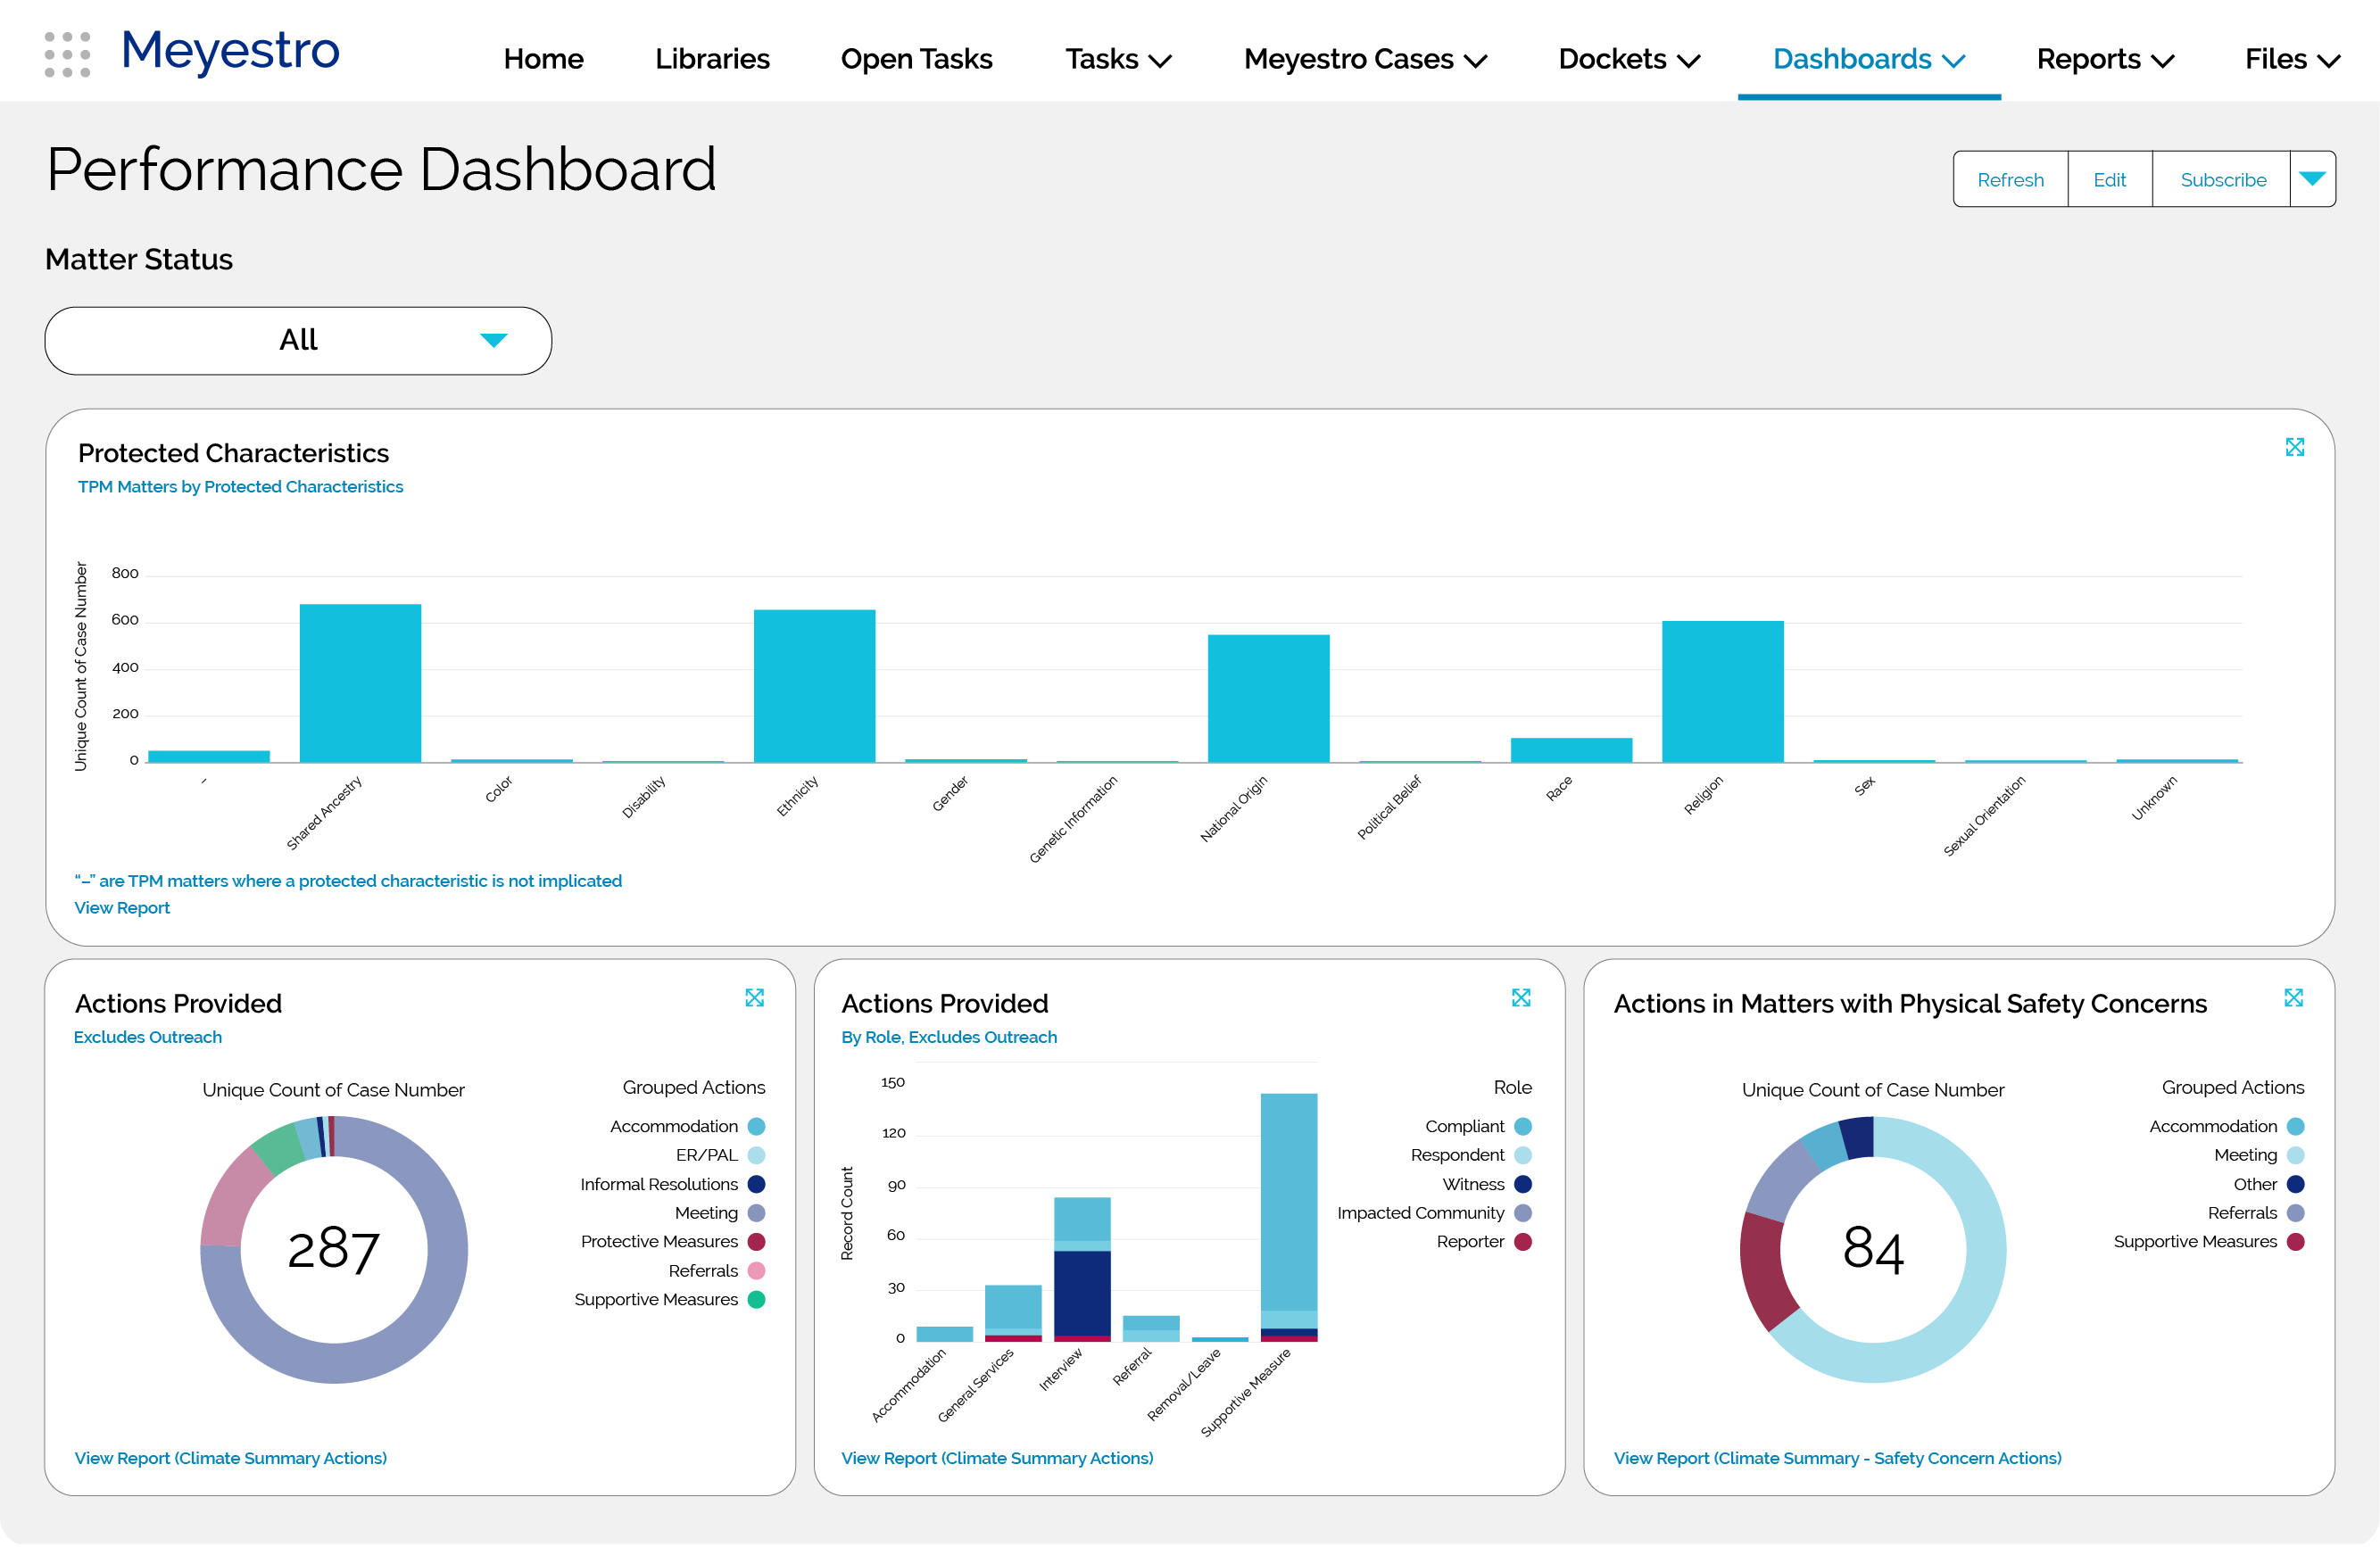
Compliance Performance Dashboards
See whether cases are moving, how timelines are being managed, and where the choke points are.
- Monitor case aging, resolution timelines, and matter throughput.
- Track care and compliance quality indicators across teams and team members.
- Support required reporting and community communications with better visualized data.
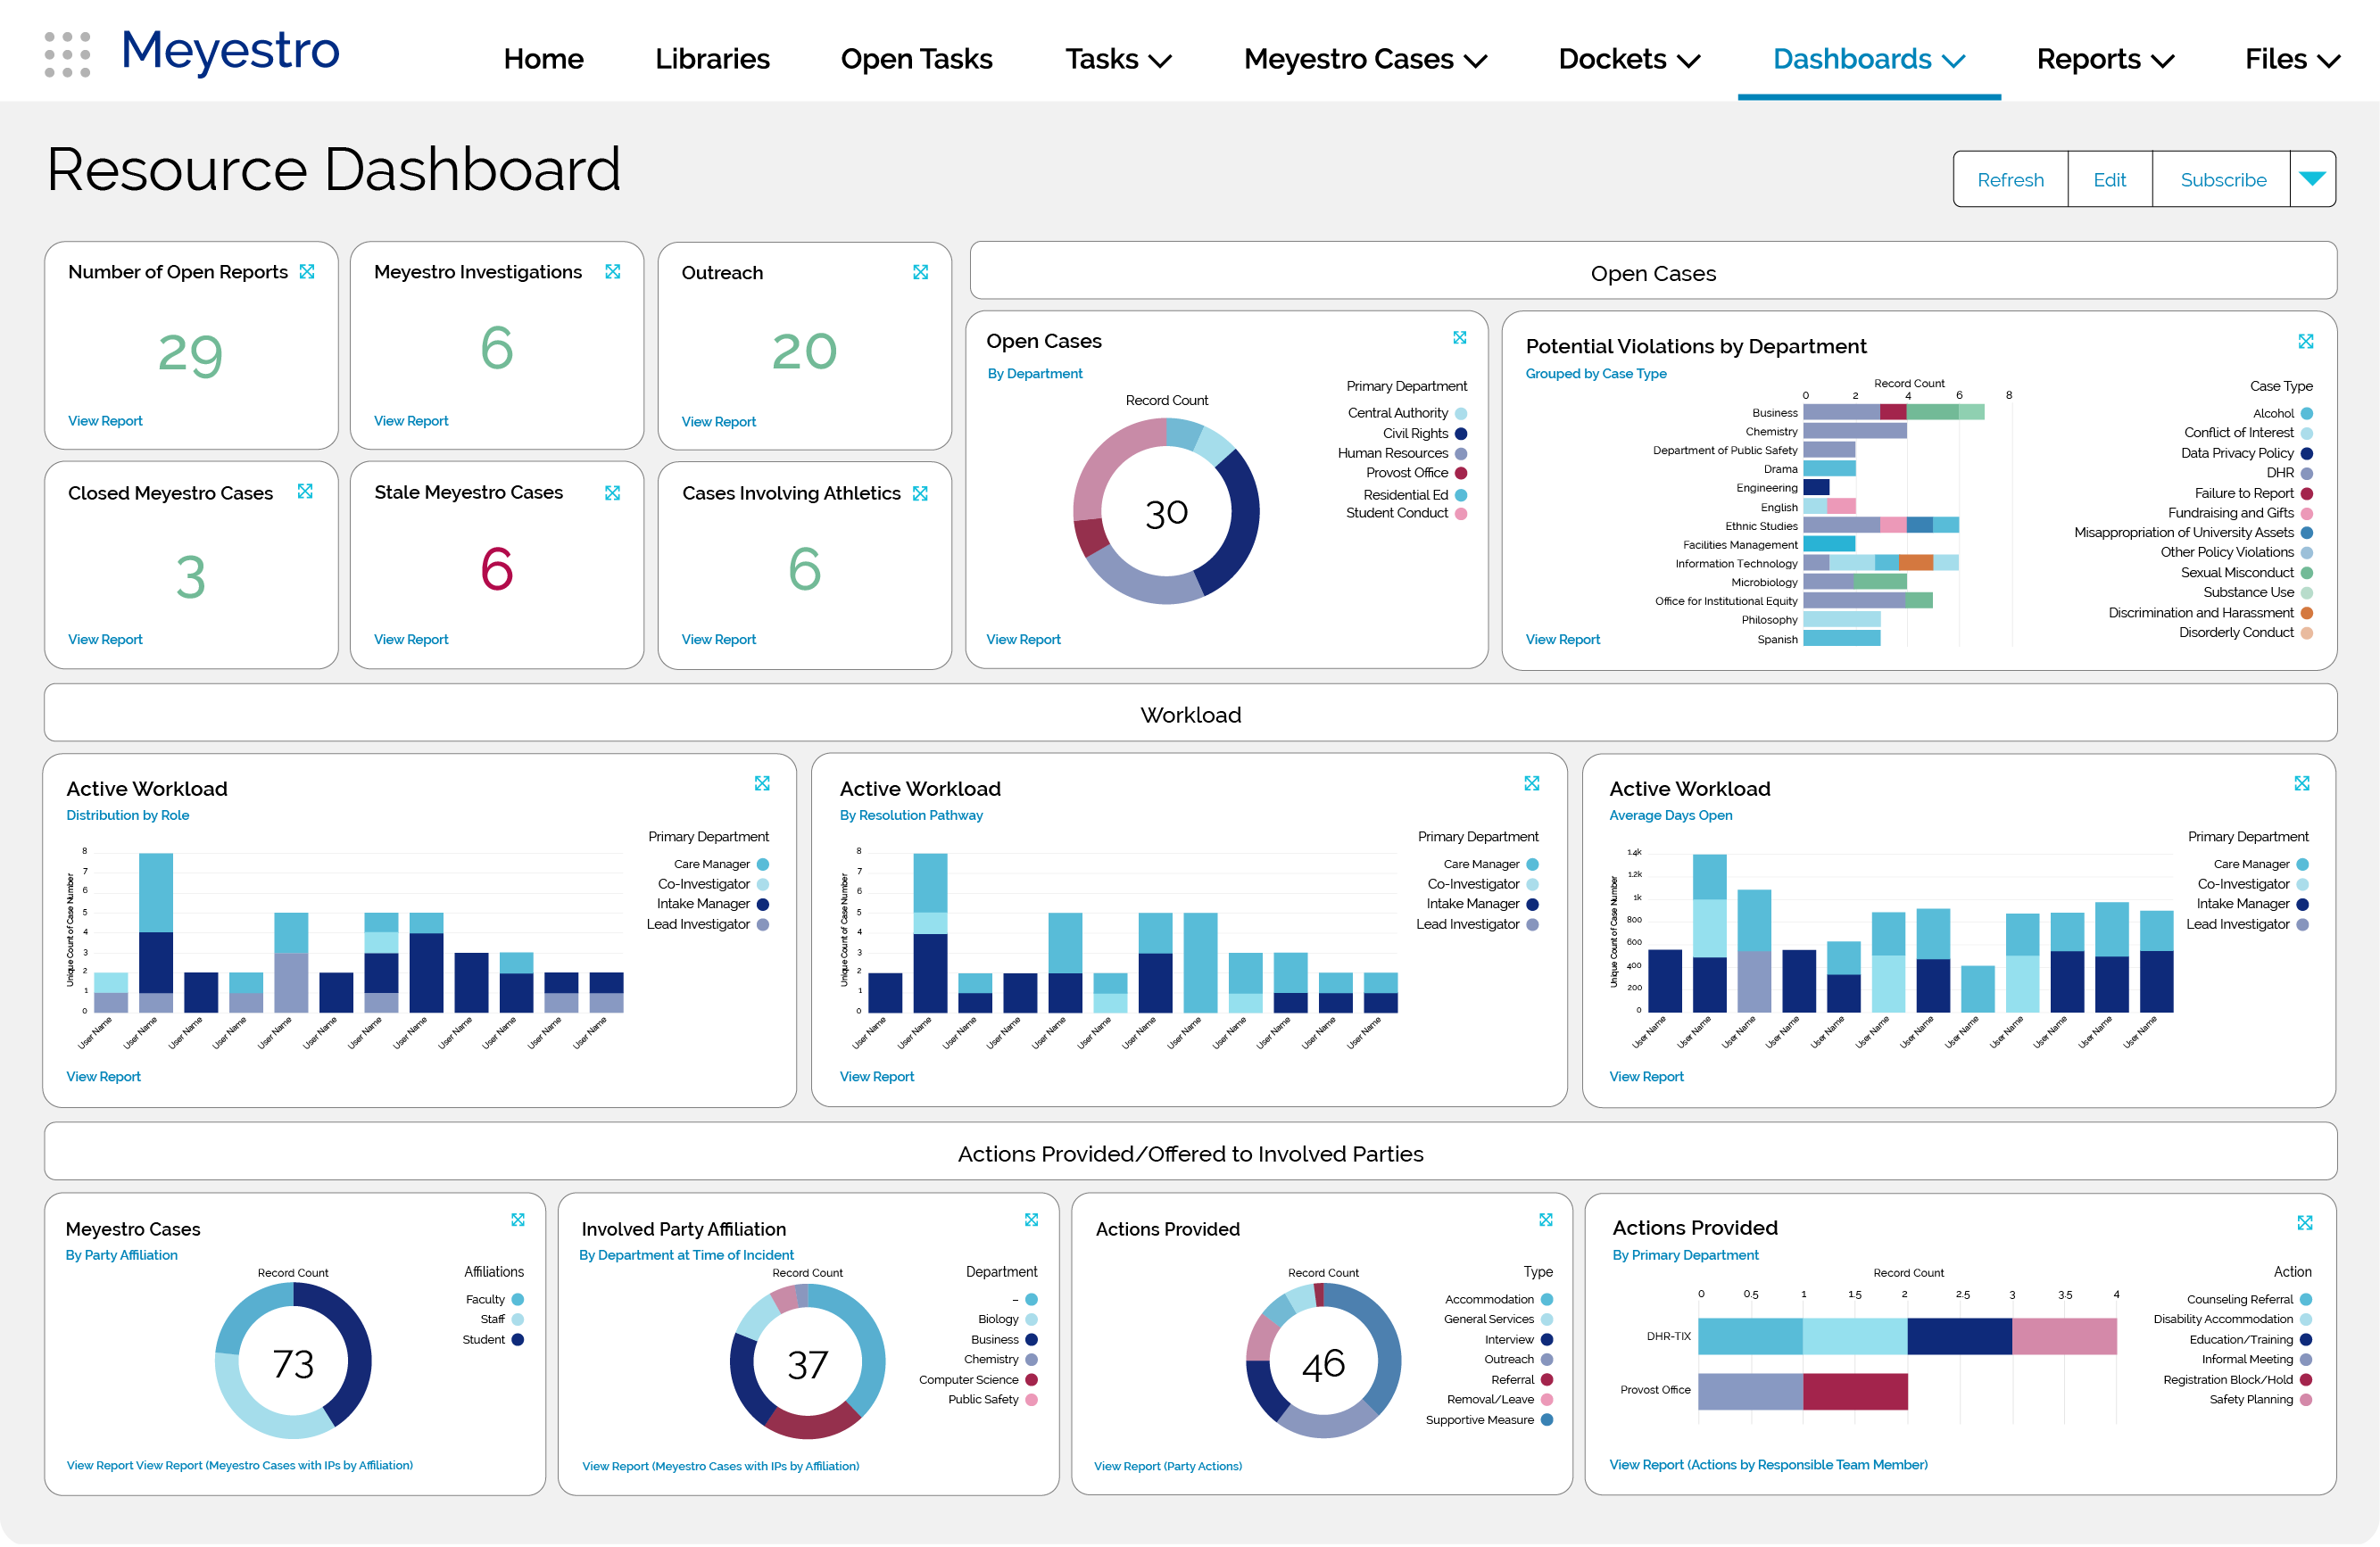
Resource Allocation Dashboards
Help managers and leaders see where work is concentrated and whether current response capacity aligns with institutional needs.
- View workload distribution across teams and team members.
- Identify bottlenecks and resource constraints.
- Support resource planning with clearer operational evidence.
From Real-Time Dashboards to Institution-Wide Readiness
Dashboards give leaders and managers the visibility to understand what is happening across incidents, locations, schools, offices and other institutional areas. Reporting turns that visibility into structured outputs for briefings, oversight, regulatory response, and institutional decision-making.
Turn Dashboard Insight Into Prepared Reporting
Also Explore: Guided Workflows
Where Compliance Meets Care™
Meyestro helps universities harmonize expert risk management, efficient compliance, and demonstrable care.